
Kubernetes Diagnostics
Introduction
Managing a Kubernetes cluster, especially in a dynamic environment like Azure Kubernetes Service (AKS), can quickly become complex. Diagnosing and resolving issues in your cluster is critical to maintaining application uptime and reliability. Azure Kubernetes Diagnostics provides a robust set of tools to investigate, diagnose, and resolve issues in your AKS cluster, simplifying the troubleshooting process.
In this article, we’ll explore how to use Azure Kubernetes Diagnostics to identify and resolve issues, and provide additional insights into its key features, advantages, disadvantages, best practices, and troubleshooting tips.
What is Azure Kubernetes Diagnostics?
Azure Kubernetes Diagnostics is a built-in feature of AKS that provides tools to investigate and resolve issues in your Kubernetes cluster. It leverages the power of Azure Monitor and container insights to offer detailed diagnostics and guidance for resolving common problems.
Steps to Use Azure Kubernetes Diagnostics
Step 1: Identify Running Services
To start diagnosing issues, first identify which services are running in your AKS cluster. Use the following command:
kubectl get service
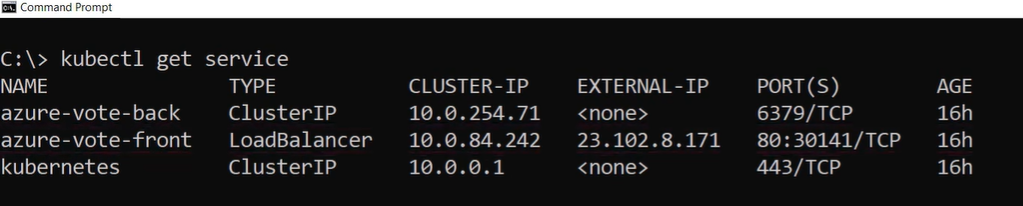
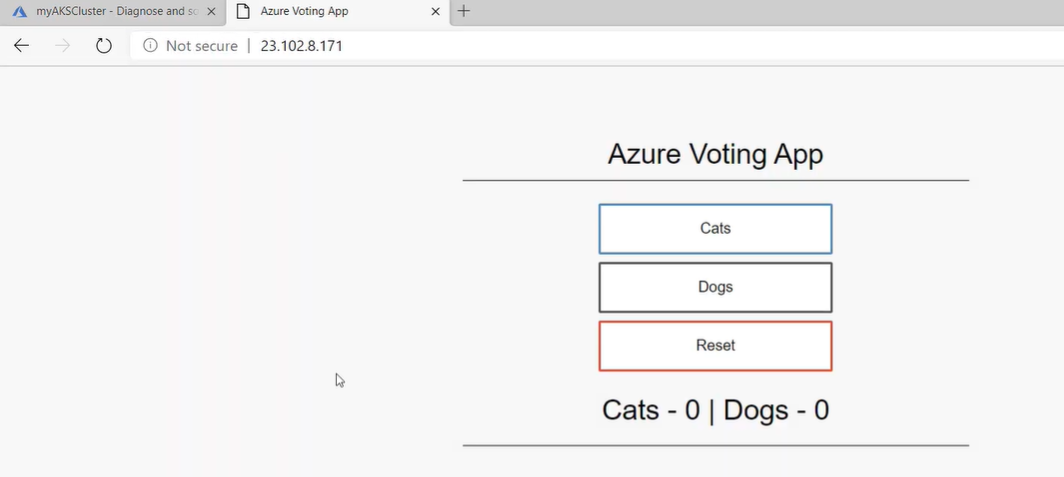
This command will list all services running in your cluster. For example, the output may include a front-end service, which you can try accessing via its external IP address.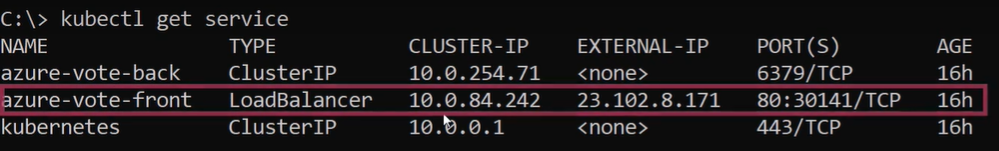
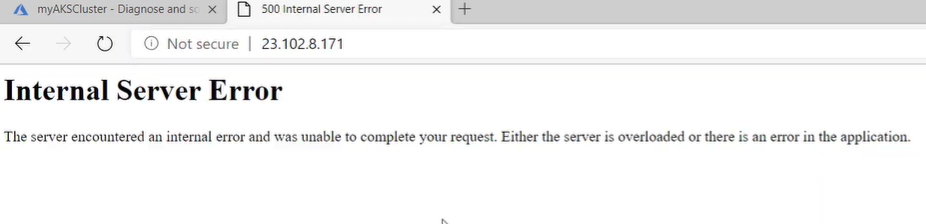
Step 2: Investigate Service Errors
If the service is not working (e.g., returning errors), the next step is to use Azure Kubernetes Diagnostics to pinpoint the issue.
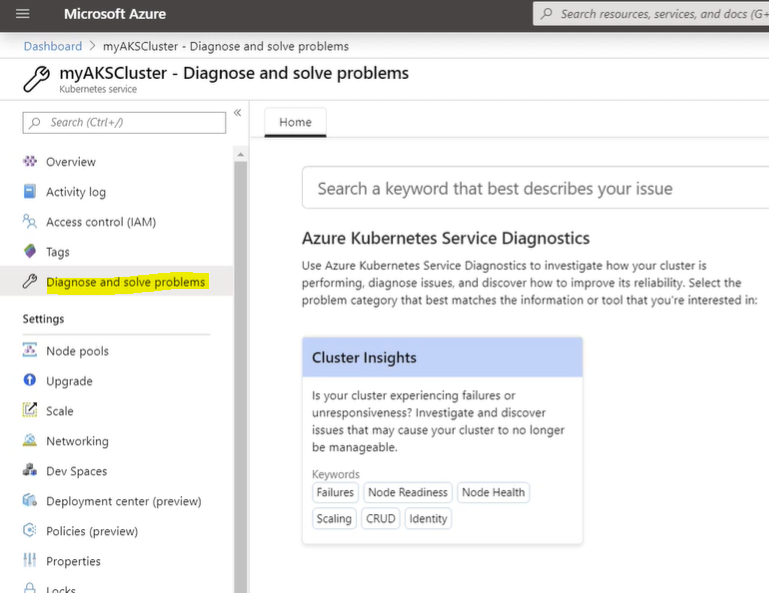
- Open the Azure Portal.
- Navigate to your AKS cluster.
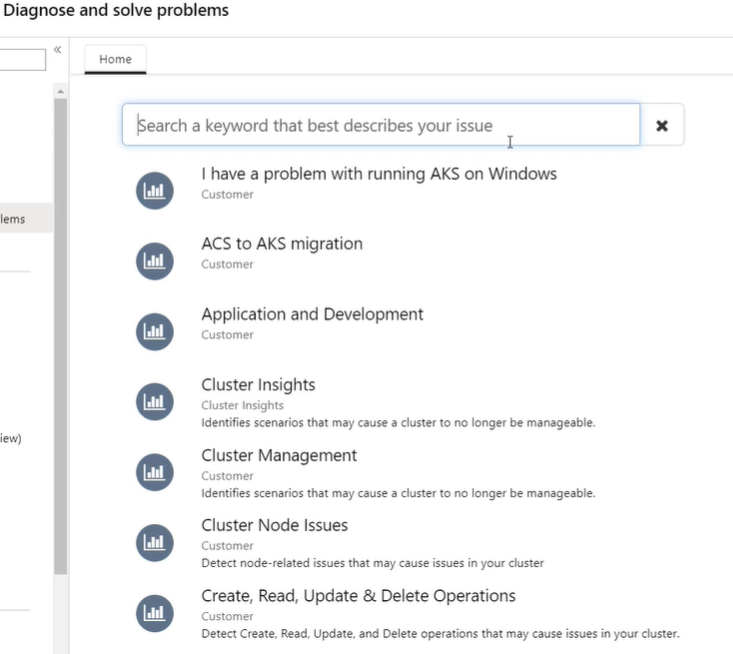
- Go to the Diagnose and Resolve Problems menu.
- Select an investigation method:
- Samples: Pre-defined diagnostic queries.
- Custom Queries: Type your issue for a tailored investigation.
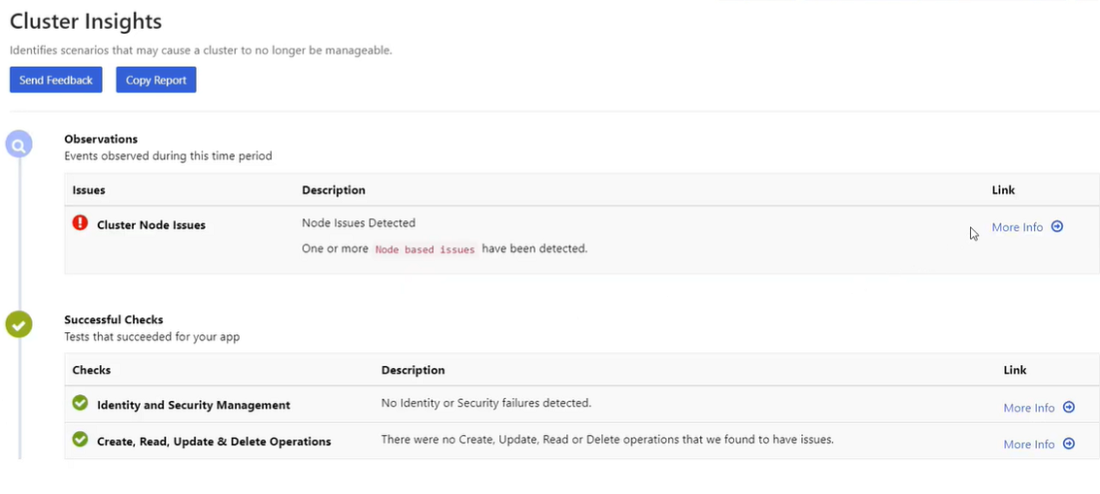
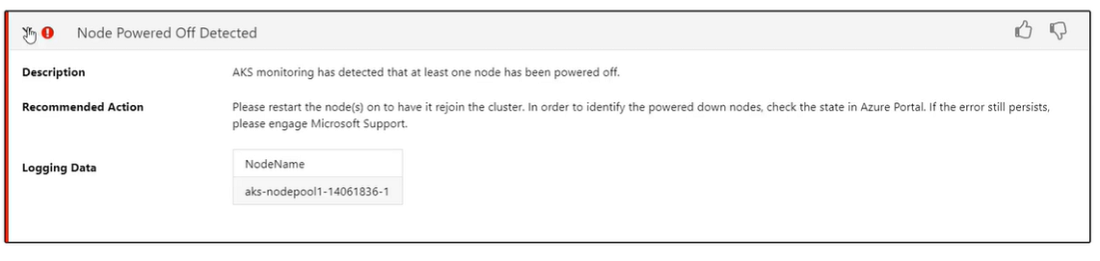
Step 3: Diagnose Node Issues
In this example, the diagnostics report may identify issues such as Node Powered Off Detected. This indicates that one or more nodes in your cluster have been shut down or are unavailable.
- Diagnostics will provide actionable suggestions, such as restarting the affected node or upgrading the cluster.
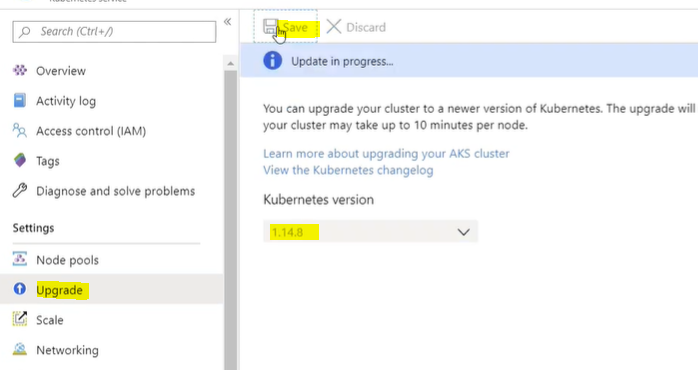
Step 4: Upgrade the Cluster
To resolve the node issue, upgrading the cluster can restart the affected nodes:
- Navigate to the Upgrade menu in the Azure Portal.
- Select the latest version of Kubernetes available.
- Click Save to start the upgrade process.
Note: Upgrading a cluster can take several minutes to complete.
Step 5: Explore Additional Diagnostics Features
Azure Kubernetes Diagnostics provides more than just failure detection. Other examples of diagnostic capabilities include:
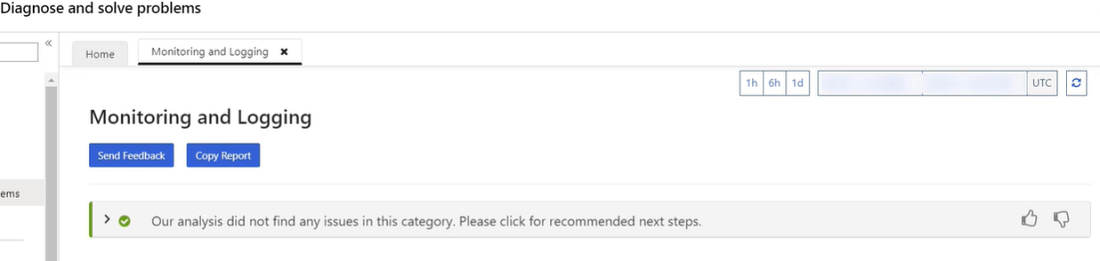
- Monitoring and Logging: Identify performance bottlenecks or issues with resource usage.
- Pod Troubleshooting: Investigate why pods are in a CrashLoopBackOff or pending state.
- Networking Issues: Diagnose DNS resolution failures or connectivity issues.
Step 6: Verify Resolution
After performing the suggested actions (e.g., upgrading the cluster), recheck the service:
- Use the same external IP address obtained earlier.
- Verify that the service is now operational.
Key Features of Azure Kubernetes Diagnostics
- Automated Diagnostics:
Automatically detect common issues like node failures, misconfigured pods, or scaling problems. - Actionable Recommendations:
Provides clear guidance on how to resolve identified issues. - Comprehensive Monitoring:
Integrated with Azure Monitor to track metrics and logs for your cluster. - Scalable Troubleshooting:
Works for clusters of all sizes, from small test environments to large production deployments. - Built-In Tools:
No additional setup is required; diagnostics are available directly in the Azure Portal.
Advantages of Azure Kubernetes Diagnostics
- Ease of Use:
Intuitive interface with pre-defined diagnostic queries simplifies troubleshooting. - Time-Saving:
Quickly identifies root causes of issues, reducing downtime. - Integrated Ecosystem:
Seamlessly integrates with Azure Monitor and other Azure services for end-to-end diagnostics. - Actionable Insights:
Offers specific recommendations to resolve issues, improving reliability. - Proactive Monitoring:
Enables you to identify potential problems before they impact applications.
Disadvantages of Azure Kubernetes Diagnostics
- Limited to AKS:
Only available for clusters hosted in Azure Kubernetes Service. - Learning Curve:
New users may require time to understand and utilize all features effectively. - Dependent on Azure Monitor:
Requires Azure Monitor to access advanced diagnostics and logging features. - Costs:
Using Azure Monitor and diagnostics features may incur additional costs based on resource usage.
Best Practices for Using Azure Kubernetes Diagnostics
- Monitor Regularly:
Continuously monitor your cluster using Azure Monitor to identify potential issues early. - Use Alerts:
Set up alerts for critical metrics like node availability, pod status, and resource utilization. - Document Diagnostics:
Maintain a record of past diagnostics to build a knowledge base for faster resolution in the future. - Upgrade Regularly:
Keep your cluster up to date with the latest Kubernetes version to avoid compatibility issues. - Automate Checks:
Use automation scripts or Azure Logic Apps to perform regular health checks on your cluster.
Troubleshooting Steps
1. Diagnostics Not Detecting Issues
- Ensure Azure Monitor is enabled for your AKS cluster.
- Verify that the cluster is running and accessible via the Azure Portal.
2. Node Issues Persist After Restart
- Check the Kubernetes event logs for additional details:
3. Diagnostic Queries Timing Out
- Verify network connectivity between your local machine and the Azure Portal.
- Increase the timeout period for CLI commands if applicable.
4. Errors in Pod Connectivity
- Check the pod logs:
- Verify the network policies and DNS configurations.
Conclusion
Azure Kubernetes Diagnostics is an indispensable tool for managing and troubleshooting AKS clusters. By providing detailed diagnostics, actionable recommendations, and seamless integration with Azure Monitor, it empowers teams to maintain highly reliable and performant Kubernetes environments.
Whether you’re diagnosing node failures, monitoring pod performance, or resolving network issues, Azure Kubernetes Diagnostics simplifies the process, helping you focus on delivering robust applications. Start leveraging its capabilities today to optimize your Kubernetes cluster management.
For more details, visit the official Azure Kubernetes Service documentation.