
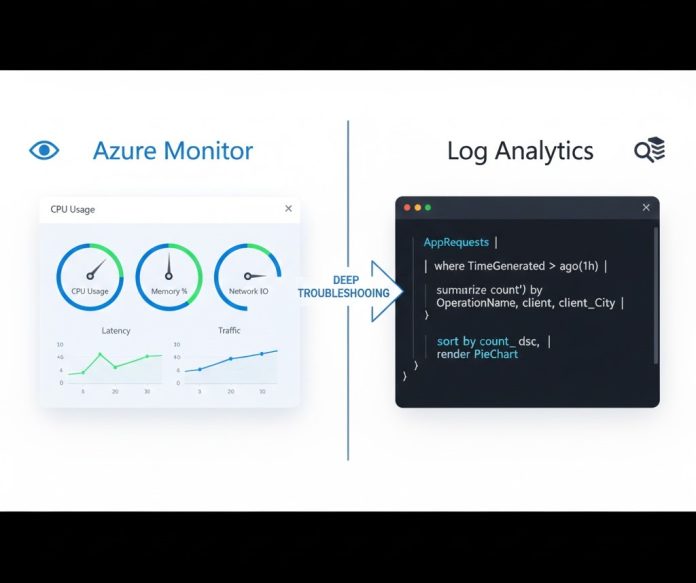
Azure Monitor vs Log Analytics
In the modern enterprise cloud landscape, a common business pain point for CTOs and senior cloud architects is the lack of unified visibility into distributed microservices and hybrid infrastructure. As organizations scale, the complexity of managing telemetry data across thousands of virtual instances often leads to “observability silos.” This fragmentation not only delays incident response times but also results in significant cloud waste and security vulnerabilities. Understanding the technical nuances of Azure Monitor vs Log Analytics is no longer optional—it is the cornerstone of a resilient cloud-native strategy in 2026.
This guide deep dives into the architectural relationship between these two services, clarifying the often-misunderstood distinction: Azure Monitor is the overarching observability suite, while Log Analytics is the high-performance data engine that powers it. For engineers coming from AWS CloudWatch or Google Cloud Logging, mastering this hierarchy is essential for building a cost-effective and compliant monitoring stack.
Deep Technical Architecture and End-to-End Flow
At its core, Azure Monitor acts as a centralized software-as-a-service (SaaS) platform designed to collect, analyze, and act on telemetry from both Azure and non-Azure environments. The internal working of the platform is divided into two primary data stores: Azure Monitor Metrics and Azure Monitor Logs. While metrics store numerical, time-series data for near-real-time alerting, the logs partition—managed by the Log Analytics engine—handles structured and unstructured system events.
The cloud-native flow begins with data collection. Modern deployments utilize the Azure Monitor Agent (AMA) and Data Collection Rules (DCRs) to filter and route telemetry at the source. This is a significant shift from legacy agents, allowing for granular control over what specific events are ingested into the Log Analytics Workspace. Once the data hits the ingestion pipeline, it is processed by the Kusto-powered engine, enabling complex KQL (Kusto Query Language) queries that can parse millions of records in seconds.
Observability Component Comparison
To optimize your search engine visibility and provide clarity for technical stakeholders, the following comparison highlights the fundamental roles of each service:
| Feature | Azure Monitor | Log Analytics |
| Service Role | Umbrella monitoring suite and visualization | Data storage and advanced query engine |
| Data Types | Metrics, Logs, Traces, and Changes | Structured and Unstructured Logs |
| Alerting | Metric-based (near-real-time) | Query-based (log search alerts) |
| Analysis Tool | Metrics Explorer, Dashboards | Log Analytics UI (KQL Mode) |
| Primary Value | High-level health and availability | Deep troubleshooting and root-cause analysis |
Real-World Use Cases: Multi-Cloud and Hybrid Performance
In a production-ready environment, the choice between metrics and logs is often driven by the specific security or performance requirements of the workload.
Enterprise Use Case: E-commerce Latency Detection
Consider a global e-commerce platform running on Azure Kubernetes Service (AKS). To maintain a high-performance user experience, the team uses Azure Monitor Metrics for “Golden Signal” monitoring (Latency, Traffic, Errors, and Saturation). However, when a specific checkout service begins to fail, the engineers switch to Log Analytics. By running cross-workspace KQL queries, they can correlate application logs with infrastructure events to identify a specific database locking issue that metrics alone would have missed.
Cloud-Native Scaling and Security
For organizations utilizing AWS or GCP alongside Azure, the Azure Monitor vs Log Analytics distinction becomes even more critical. Using the AMA, architects can ingest logs from EC2 instances or GCE VMs into a centralized Log Analytics workspace. This provides a “single pane of glass” for compliance auditing across the entire hybrid cloud, ensuring that security logs are retained in a tamper-proof environment for the required duration.
Security, Compliance, and Risk Management
Managing sensitive telemetry data requires a robust approach to IAM and encryption. Azure Monitor ensures that data is encrypted at rest using Microsoft-managed keys by default, with an option for Customer-Managed Keys (CMK) for high-compliance industries.
-
Access Control: Use Table-level RBAC in Log Analytics to ensure that developers only see application logs while security teams have access to sensitive audit trails.
-
Compliance: Log Analytics supports long-term retention (up to 7 years) and Auxiliary Logs plans, which significantly reduce the cost of storing low-touch data required for HIPAA or GDPR compliance.
-
Logging Risks: A common mistake is “logging everything,” which can lead to unexpected billing spikes. Implementing sampling and transformation rules at the DCR level is a recommended cost optimization technique.
Best Practices and Production Recommendations
For senior cloud architects, the following recommendations represent the gold standard for deploying observability at scale:
-
Migrate to Azure Monitor Agent (AMA): If you are still using the legacy Log Analytics agent, prioritize migration. The AMA offers superior security, better scalability, and reduced resource overhead on your VMs.
-
Use Service Tags and Managed Identities: Avoid using static credentials for log ingestion. Leverage Managed Identities to authenticate your resources to the Log Analytics workspace securely.
-
Optimize KQL Queries: Avoid using the
searchoperator in large environments. Instead, specify the table and use thewhereclause to filter byTimeGeneratedfirst. This improves query performance and reduces compute costs. -
Implement Data Collection Rules (DCR): Use DCRs to strip out verbose or non-essential log lines before they are ingested. Since you are billed on data volume, this is the most effective way to control your Azure spending.
-
Leverage Insights: Use curated experiences like VM Insights and Container Insights. These provide out-of-the-box dashboards that leverage both Azure Monitor metrics and Log Analytics data, reducing the time to value for your operations teams.
Observability Data Flow Comparison
Understanding where your data resides is crucial for both performance and cost. Use this table as a reference for your monitoring strategy:
| Data Source | Primary Store | Evaluation Engine |
| Platform Metrics | Azure Monitor Metrics | Metrics Explorer |
| Syslog / Event Logs | Log Analytics Workspace | KQL / Log Analytics UI |
| Custom Metrics | Azure Monitor Metrics | Custom Dashboards / API |
| Activity Logs | Azure Monitor Logs | Log Analytics / Search |
Conclusion
Mastering the ecosystem of Azure Monitor vs Log Analytics is about finding the right balance between real-time visibility and deep historical analysis. By treating Azure Monitor as your strategic dashboard and Log Analytics as your tactical deep-dive tool, you can build an observability framework that supports both rapid innovation and rigid security standards. As you refine your cloud-native footprint, remember that the most successful architects are those who use these tools not just to see what is happening, but to understand why it is happening.
Would you like me to generate a specific KQL query template for your most critical application logs?