
Monitor kubernetes cluster with grafana
In today’s dynamic DevOps environments, monitoring and logging are essential for ensuring application reliability and performance. Tools like Prometheus and Grafana provide powerful solutions for collecting, visualizing, and analyzing metrics and logs in real-time.
This guide will walk you through the process of automating monitoring and logging for applications using Prometheus and Grafana, with hands-on examples, step-by-step processes, and official references.
Monitor kubernetes cluster with grafana : Why Monitor Applications?
The Importance of Monitoring
- Proactive Issue Detection:
- Identify and resolve issues before they affect end-users.
- Performance Optimization:
- Analyze bottlenecks and improve application performance.
- Operational Insights:
- Gain visibility into application behavior and infrastructure health.
- Compliance and Auditing:
- Track logs and metrics for security and compliance purposes.
Kubernetes Monitoring with Prometheus and Grafana
involves tracking the performance, health, and metrics of Kubernetes clusters and workloads. Here’s a brief overview:
- Prometheus:
- Collects metrics from Kubernetes components (nodes, pods, services) via exporters like kube-state-metrics and node-exporter.
- Stores metrics in a time-series database for querying.
- Grafana:
- Visualizes metrics from Prometheus in customizable dashboards.
- Provides prebuilt Kubernetes dashboards for quick insights.
- Setup Steps:
- Deploy Prometheus and Grafana using Helm or Kubernetes manifests.
- Configure Prometheus to scrape metrics from Kubernetes components and exporters.
- Connect Grafana to Prometheus as a data source.
- Import Kubernetes-specific Grafana dashboards or create custom ones.
- Key Metrics Monitored:
- Node and pod resource usage (CPU, memory, disk).
- Cluster health (API server, etcd).
- Application-level metrics.
- Alerts for threshold breaches (via Prometheus Alertmanager).
- Deployment:
- Use Helm charts:
prometheus-community/kube-prometheus-stack. - Include persistent storage for data retention and backups.
- Use Helm charts:
This setup provides robust monitoring for Kubernetes environments.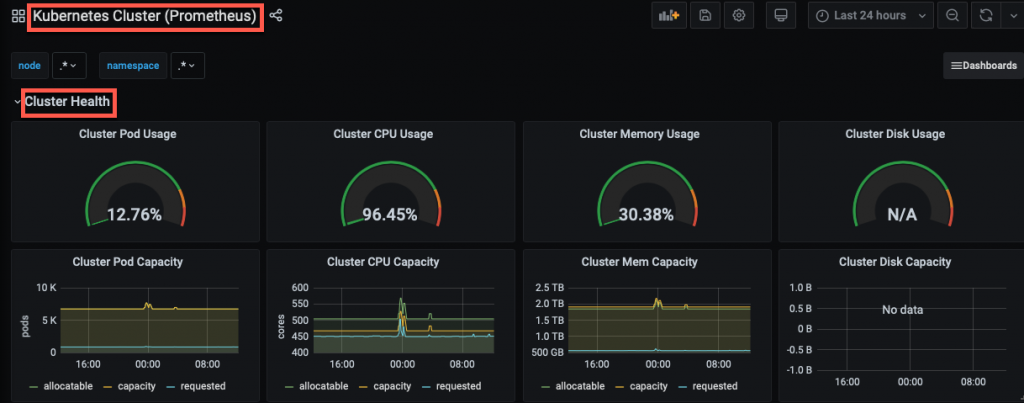
Monitor elasticsearch with grafana
Monitoring Elasticsearch with Grafana provides insights into cluster performance, health, and search efficiency. Here’s a brief guide:
1. Prerequisites
- An Elasticsearch cluster is running.
- Grafana is installed and accessible.
- Elasticsearch metrics are exposed using tools like Prometheus Exporter or Elasticsearch API.
2. Steps to Monitor Elasticsearch with Grafana
a. Expose Elasticsearch Metrics
- Use the Elasticsearch Exporter for Prometheus:
- Deploy the prometheus-elasticsearch-exporter in your environment.
- It collects metrics like node stats, indices, and cluster health.
- Alternatively, use Elasticsearch’s built-in monitoring APIs to fetch metrics directly.
b. Configure Prometheus
- Add the Elasticsearch Exporter’s endpoint to Prometheus’ configuration (
prometheus.yml):scrape_configs: - job_name: 'elasticsearch' static_configs: - targets: ['<exporter-host>:<port>']
c. Add Elasticsearch as a Data Source in Grafana
- Navigate to Settings > Data Sources in Grafana.
- Select Prometheus (or Elasticsearch directly if APIs are used).
- Configure:
- URL:
http://<Prometheus-IP>:9090(or Elasticsearch URL if applicable). - Authentication (if required).
- URL:
d. Import or Create Dashboards
- Import prebuilt Elasticsearch Grafana dashboards from the Grafana Dashboard Library (e.g., dashboard ID 4358).
- Create custom panels to display key metrics.
3. Key Metrics to Monitor
- Cluster Health:
- Active shards, pending tasks, unassigned shards.
- Node Performance:
- CPU, memory, disk I/O usage.
- Indexing and Search:
- Query latency, document indexing rate.
- Heap and JVM Metrics:
- JVM memory usage, garbage collection.
4. Alerts and Thresholds
- Use Grafana Alerting to set thresholds for metrics like:
- Cluster health status.
- High query latency.
- JVM heap usage nearing limits.
- Configure notifications to Slack, email, or other services.
This setup ensures comprehensive monitoring of Elasticsearch with actionable insights into its performance and reliability.
Monitor linux server with grafana
Prometheus
Prometheus is an open-source monitoring and alerting toolkit that collects metrics from targets at specified intervals, stores them, and provides a query language (PromQL) to retrieve and analyze metrics.
- Key Features:
- Pull-based metric collection.
- Multi-dimensional data model.
- Built-in alerting.
Grafana
Grafana is an open-source visualization tool that integrates with Prometheus and other data sources to create interactive dashboards for metrics visualization.
- Key Features:
- Customizable dashboards.
- Integration with multiple data sources.
- Alerting and notifications.
Prerequisites
- A running application:
- Use any web application or containerized service.
- Docker installed:
- Install Docker:
sudo apt update sudo apt install docker.io -y - Verify Docker installation:
docker --version
- Install Docker:
- Docker Compose installed:
- Install Docker Compose:
sudo apt install docker-compose -y - Verify installation:
docker-compose --version
- Install Docker Compose:
Step 1: Set Up Prometheus
1.1 Create Prometheus Configuration
- Create a directory for Prometheus:
mkdir prometheus && cd prometheus - Create a
prometheus.ymlconfiguration file:global: scrape_interval: 15s scrape_configs: - job_name: "node" static_configs: - targets: ["localhost:9100"]scrape_interval: How often Prometheus scrapes metrics.job_name: Identifier for the metrics source.
1.2 Create a Docker Compose File
Create a docker-compose.yml file:
version: "3.7"
services:
  prometheus:
    image: prom/prometheus:latest
    container_name: prometheus
    ports:
      - "9090:9090"
    volumes:
      - ./prometheus.yml:/etc/prometheus/prometheus.yml
1.3 Start Prometheus
- Start the Prometheus container:
docker-compose up -d - Access Prometheus:
- Open
http://localhost:9090in your browser.
- Open
Step 2: Server monitoring with grafana : Set Up Grafana
2.1 Create a Docker Compose File
Add Grafana to docker-compose.yml:
  grafana:
    image: grafana/grafana:latest
    container_name: grafana
    ports:
      - "3000:3000"
2.2 Start Grafana
- Start Grafana:
docker-compose up -d grafana - Access Grafana:
- Open
http://localhost:3000in your browser. - Default credentials:
admin/admin.
- Open
Step 3: Configure Prometheus as a Data Source in Grafana
- Log in to Grafana (
http://localhost:3000). - Navigate to Configuration > Data Sources > Add Data Source.
- Select Prometheus.
- Enter the URL for Prometheus:
http://prometheus:9090 - Click Save & Test.
Step 4: Visualize Metrics with Grafana Dashboards
- Create a new dashboard:
- Go to Dashboards > New Dashboard > Add a New Panel.
- Query Prometheus for metrics:
- Example PromQL query:
node_cpu_seconds_total
- Example PromQL query:
- Customize visualizations:
- Choose graph types, time ranges, and thresholds.
Step 5: Enable Monitoring for Applications
5.1 Monitor a Node.js Application
- Install the Prometheus Client library:
npm install prom-client - Add metrics to your application:
const express = require('express'); const client = require('prom-client'); const app = express(); const counter = new client.Counter({ name: 'http_requests_total', help: 'Total number of HTTP requests', }); app.get('/', (req, res) => { counter.inc(); res.send('Hello, Prometheus!'); }); client.collectDefaultMetrics(); app.get('/metrics', (req, res) => { res.set('Content-Type', client.register.contentType); res.end(client.register.metrics()); }); app.listen(3000, () => console.log('App running on port 3000')); - Update Prometheus configuration:
scrape_configs: - job_name: "nodejs" static_configs: - targets: ["localhost:3000"] - Restart Prometheus:
docker-compose restart prometheus
5.2 Enable Alerting
- Add alerting rules to
prometheus.yml:rule_files: - "alerts.yml" alerting: alertmanagers: - static_configs: - targets: ["localhost:9093"] - Create
alerts.yml:groups: - name: example rules: - alert: HighCPUUsage expr: node_cpu_seconds_total > 0.5 for: 2m labels: severity: critical annotations: summary: "High CPU usage detected" description: "CPU usage is above 50% for the last 2 minutes." - Reload Prometheus configuration:
docker-compose restart prometheus
Advanced Features
1. Centralized Logging
- Set up a logging stack using the ELK Stack (Elasticsearch, Logstash, Kibana).
- Stream application logs to Elasticsearch:
- Use tools like Fluentd or Filebeat.
2. Distributed Tracing
- Implement tracing with tools like Jaeger or Zipkin.
- Correlate logs, traces, and metrics for deeper insights.
3. Exporters
Prometheus relies on exporters for collecting metrics:
- Node Exporter: System metrics.
- Blackbox Exporter: Network probing.
Install the Node Exporter:
docker run -d -p 9100:9100 prom/node-exporter
Conclusion
Monitoring and logging with Prometheus and Grafana provide a robust solution for tracking application performance and system health. By automating monitoring workflows and visualizing metrics in Grafana, you can ensure reliability, scalability, and operational excellence.
Would you like me to proceed with post #5 (Configuration Management)? Let me know!